ICICI-Prudential-Multicap-Fund-Growth
Fund Manager : Sankaran Naren | Benchmark : NIFTY500 MULTICAP 50:25:25 TRI | Category : Equity: Multi Cap

782.2 0.16 (0.02 %)

NAV as on 19-05-2025

1,450.46 Cr

AUM as on 30-04-2025

Rtn ( Since Inception )

15.28%

Inception Date

Oct 01, 1994

Expense Ratio

1.74%

Fund Status

Open Ended Scheme

Min. Investment (Rs)

5,000

Min. Topup (Rs)

1,000

Min. SIP Amount (Rs)

500

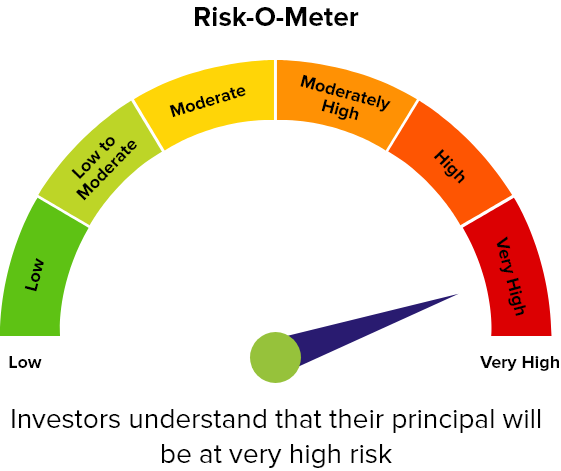
Risk Status

very high

Investment Objective : The scheme seeks to achieve long-term capital appreciation through investment in the core sectors of the economy like telecom, energy, transportation and financial services

Returns (%)
1 Mon (%) 3 Mon (%) 6 Mon (%) 1 Yr (%) 3 Yrs (%) 5 Yrs (%) 10 Yrs (%)
Fund 4.52 9.03 3.27 10.32 24.93 29.22 14.51
Benchmark - NIFTY500 MULTICAP 50:25:25 TRI 7.07 11.75 3.36 9.8 22.54 29.92 15.27
Category - Equity: Multi Cap 5.49 10.23 1.31 8.31 23.13 29.09 14.74
Rank within Category 26 26 4 8 5 4 3
Number of Funds within Category 30 29 27 24 14 8 6

Returns less than 1 year are in absolute and Returns greater than 1 year period are compounded annualised (CAGR)

Equity Holdings (Top 10)
CompanyHoldings (%)
TREPS8.51
ICICI BANK LIMITED EQ NEW FV RS. 2/-5.9
RELIANCE INDUSTRIES LIMITED EQ4.14
HDFC BANK LIMITED EQ NEW FV RE. 1/-3.72
AXIS BANK LIMITED EQ NE FV RS. 2/-3.43
SUN PHARMACEUTICAL INDUSTRIES LTD. EQ NEW F.V. RE.1/-2.58
INFOSYS LIMITED EQ FV RS 52.27
LARSEN AND TOUBRO LIMITED EQ NEW FV RS.2/-2.13
MARUTI SUZUKI INDIA LIMITED EQ1.76
STATE BANK OF INDIA EQ NEW RE. 1/-1.7
ADANI WILMAR LIMITED EQ NEW FV Re.1/-1.62
TATA CHEMICALS LIMITED EQ1.49
NTPC LIMITED EQ1.46
BHARTI AIRTEL LIMITED EQ NEW FV RS 5/-1.44
FSN E-COMMERCE VENTURES LIMITED EQ NEW FV RE.1/-1.39
OIL AND NATURAL GAS CORPORATION LIMITED EQ NEW F.V RS.5/-1.37
HINDUSTAN UNILEVER LIMITED EQ F.V. RS 11.37
UNITED BREWERIES LIMITED EQ NEW FV RE.1/-1.32
ALKEM LABORATORIES LIMITED EQ1.3
AIA ENGINEERING LIMITED EQ NEW RE.2/-1.29
TATA STEEL LIMITED EQ NEW FV RE.1/-1.28
MAX FINANCIAL SERVICES LIMITED EQ NEW FV RS. 2/-1.27
LIC HOUSING FINANCE LIMITED EQ NEW F.V. RS.2/-1.25
SYNGENE INTERNATIONAL LIMITED EQ1.19
SBI LIFE INSURANCE COMPANY LIMITED EQ1.13
ATUL LIMITED EQ1.1
INDIAMART INTERMESH LIMITED EQ1.1
TVS MOTOR COMPANY LIMITED EQ FV RE.1/-1.07
J.K.CEMENT LIMITED EQ1.03
HDFC LIFE INSURANCE COMPANY LIMITED EQ0.95
SRF LIMITED EQ0.94
ICICI LOMBARD GEN INSURANCE CO LTD EQ0.9
BHARAT FORGE LIMITED EQ NEW FV RS. 2/-0.88
ORIENT ELECTRIC LIMITED EQ0.84
CUMMINS INDIA LIMITED EQ FV RS.20.83
OIL INDIA LTD. EQ0.82
ACC LIMITED EQ F.V. RS.100.8
STAR HEALTH AND ALLIED INSURANCE COMPANY LTD. EQ0.77
NMDC LIMITED EQ NEW RS.1/-0.75
THE PHOENIX MILLS LIMITED EQ NEW RS.2/-0.74
LUPIN LIMITED EQ NEW F.V. RS.2/-0.73
THE RAMCO CEMENTS LIMITED EQ NEW RE.1/-0.73
SUN TV NETWORK LIMITED EQ NEW RS. 5/-0.72
CMS INFO SYSTEMS LIMITED EQ0.7
CONTAINER CORPORATION OF INDIA LTD. EQ NEW FV RS. 5/-0.68
AFFLE (INDIA) LIMITED EQ NEW FV RS. 2/-0.67
CITY UNION BANK LIMITED EQ NEW RS. 1/-0.65
PI INDUSTRIES LIMITED EQ NEW FV Re.1/-0.64
GLAND PHARMA LIMITED EQ NEW FV Re.1/-0.64
BATA INDIA LIMITED EQ NEW FV RS. 5/-0.64
UNION BANK OF INDIA EQ0.63
SOBHA LIMITED EQ0.63
UPL LIMITED EQ PP RE. 1/0.61
CYIENT LIMITED EQ NEW FV RS.5/-0.61
MPHASIS LIMITED EQ0.6
NIRLON LIMITED EQ0.59
PVR LIMITED EQ0.56
TEAM LEASE SERVICES LIMITED EQ NEW FV RS. 10/-0.55
SBI CARDS AND PAYMENT SERVICES LIMITED EQ0.55
MAHINDRA CIE AUTOMOTIVE LIMITED EQ0.55
DABUR INDIA LIMITED EQ F.V. RE.10.55
RAIN INDUSTRIES LIMITED EQ NEW RS.2/-0.55
AUROBINDO PHARMA LIMITED EQ NEW F.V. RE.1/-0.53
ITC LIMITED EQ NEW FV RE.1/-0.52
EPL LIMITED EQ NEW FV RS.2/-0.51
91 Days Treasury Bills0.51
KALPATARU POWER TRANSMISSION LTD EQ NEW F.V RS.2/-0.49
INDUSIND BANK LIMITED EQ0.48
PNC INFRATECH LIMITED EQ NEW FV RS. 2/-0.48
APOLLO TYRES LIMITED EQ RE.1/-0.48
JM FINANCIAL LIMITED EQ NEW RE. 1/-0.47
RHI MAGNESITA INDIA LIMITED EQ0.47
THE FEDERAL BANK LIMITED EQ NEW FV RS.2/-0.46
INDIAN BANK EQ0.46
KAJARIA CERAMICS LIMITED EQ NEW FV RE. 1/-0.45
GUJARAT NARMADA VALLEY FERT. & CHEM. LIMITED EQ0.44
91 Days Treasury Bills0.44
LAXMI ORGANIC INDUSTRIES LIMITED EQ NEW FV RS. 2/-0.42
91 Days Treasury Bills0.42
CARBORUNDUM UNIVERSAL LIMITED EQ NEW Re.1/-0.39
SONA BLW PRECISION FORGINGS LIMITED EQ0.39
BAJAJ ELECTRICALS LIMITED EQ NEW F.V. RS.2/-0.39
INDIAN ENERGY EXCHANGE LIMITED EQ NEW FV RS 10.39
GUJARAT GAS LIMITED EQ NEW FV RS 20.38
MANGALORE REFINERY AND PETROCHEMICALS LIMITED EQ0.38
GUJARAT STATE PETRONET LTD EQ0.37
SHREE CEMENT LIMITED EQ0.37
BIRLASOFT LIMITED NEW EQ RS. 2/-0.36
GRAPHITE INDIA LIMITED NEW EQ RS. 2/-0.35
EQUITAS SMALL FINANCE BANK LIMITED EQ0.34
IRB INFRASTRUCTURE DEVELOPERS LTD EQ NEW FV RE.1/-0.34
EIH LIMITED EQ NEW FV RS.2/-0.34
V-GUARD INDUSTRIES LIMITED EQ NEW FV Re. 1/-0.34
CSB BANK LIMITED EQ0.34
MOLD-TEK PACKAGING LIMITED EQ NEW FV RS. 5/-0.33
NCC LIMITED EQ NEW FV RS. 2/-0.33
JK LAKSHMI CEMENT LIMITED EQ NEW RS.5/-0.28
HCL TECHNOLOGIES LIMITED EQ F.V. RS.2/-0.24
FDC LIMITED EQ FV RE 1/-0.22
91 Days Treasury Bills0.21
NAVIN FLUORINE INTERNATIONAL LTD EQ NEW FV RS. 2/-0.2
SUNDRAM FASTENERS LIMITED EQ FV RS. 1/-0.19
ROLEX RINGS LIMITED EQ0.19
BARBEQUE-NATION HOSPITALITY LIMITED EQ NEW FV RS. 5/-0.18
GATEWAY DISTRIPARKS LIMITED EQ0.18
ZEE ENTERTAINMENT ENTERPRISES LTD EQ F.V.RE.10.17
Dabur India Ltd.0.13
MASTEK LIMITED EQ F.V.RS.50.12
YATRA ONLINE LIMITED EQ NEW FV RE.1/-0.12
SANSERA ENGINEERING LIMITED EQ NEW FV RS. 2/-0.1
Cash Margin - Derivatives0.1
BUTTERFLY GANDHIMATHI APPLIANCES LIMITED EQ0.05
91 Days Treasury Bills0.04
91 Days Treasury Bills0.01
IndusInd Bank Ltd.-0.05
Union Bank Of India-0.25
SBI Cards and Payment Services Ltd.-0.3
Shree Cement Ltd.-0.37
Net Current Assets-0.4
SRF Ltd.-0.94
Show All Holdings
Sector Allocation (%)
Financial ServicesN/AOil, Gas & Consumable...HealthcareChemicalsAutomobile and Auto C...Fast Moving Consumer...Information TechnologyCapital GoodsConstruction3030242418181212660025.79 %9.87 %7.46 %7.19 %6.39 %5.61 %5.38 %4.87 %4.17 %3.77 %
Asset Allocation
Asset Class Allocation (%)
Equity 90.13
Debt 1.63
Cash & Cash Equivalents 8.21
Derivatives -1.78


Portfolio Behavior
Mean 19.34
Sharpe Ratio 0.96
Alpha 3.77
Beta 0.85
Standard Deviation 13.89
Sortino 1.71
Portfolio Turnover 93
Market Cap Distribution
Large CapMid CapSmall CapOthers40403030202010100039.84 %25.34 %24.95 %8.06 %
Yearly Performance (%)
Created with Highstock 2.1.5ValuesICICI Prudential Multicap Fund - GrowthNIFTY500 MULTICAP 50:25:25 TRIEquity: Multi Cap2013201420152016201720182019202020212022-250255075
Standard Performance
Scheme
ICICI Pru Multi Cap Gr
Benchmark
NIFTY500 MULTICAP 50:25:25 TRI
Additional Benchmark
NIFTY 50 TRI
Category Average
Period Returns Value of
10000 invested
Returns Value of
10000 invested
Returns Value of
10000 invested
Returns Value of
10000 invested
1 Year 10.32 %11,0329.8 %10,98012.93112938.3110831
3 Year 24.93 %19,49922.54 %18,40117.821635623.1318668
5 Year 29.22 %36,02929.92 %37,01623.72896429.0935848
10 Year 14.51 %38,76515.27 %41,41613.073415714.7439551
Since inception 15.28 %4,64,89816.19 %5,74,85313.9934308615.94542375
Riskometer
riskometer
SIP Returns (Monthly SIP of Rs. 10,000)
3 Year 5 Year 10 Year 15 Year
Scheme Name Invested Amt Current Value XIRR (%) Invested Amt Current Value XIRR (%) Invested Amt Current Value XIRR (%) Invested Amt Current Value XIRR (%)
ICICI Pru Multi Cap Gr 360,000 487,165 21.78 600,000 1,017,950 21.97 1,200,000 2,928,154 17.24 1,800,000 6,758,531 16.19
NIFTY500 MULTICAP 50:25:25 TRI 360,000 475,695 19.98 600,000 988,919 20.74 1,200,000 2,989,975 17.63 1,800,000 6,865,281 16.37
Equity: Multi Cap 360,000 475,416 19.9 600,000 986,321 20.55 1,200,000 2,992,424 17.59 1,800,000 7,188,746 16.83

Disclaimer : Mutualfundtools.com has gathered all the data, information, statistics from the sources believed to be highly reliable and true. All necessary precautions have been taken to avoid any error, lapse or insufficiency, however, no representations or warranties are made (express or implied) as to the reliability, accuracy or completeness of such information. mutualfundtools.com cannot be held liable for any loss arising directly or indirectly from the use of, or any action taken in on, any information appearing herein.

Returns less than 1 year are in absolute and greater than 1 year are compounded annualised (CAGR). SIP returns are shown in XIRR (%).

The Risk Level of any of the schemes must always be commensurate with the risk profile, investment objective or financial goals of the investor concerned. Mutual Fund Distributors (MFDs) or Registered Investment Advisors (RIAs) should take the risk profile and investment needs of individual investors into consideration and make scheme(s) or asset allocation recommendations accordingly.

Mutual Fund investments are subject to market risks, read all scheme related documents carefully. Past performance may or may not be sustained in the future. Investors should always invest according to their risk appetite and consult with their mutual fund distributors or financial advisor before investing.